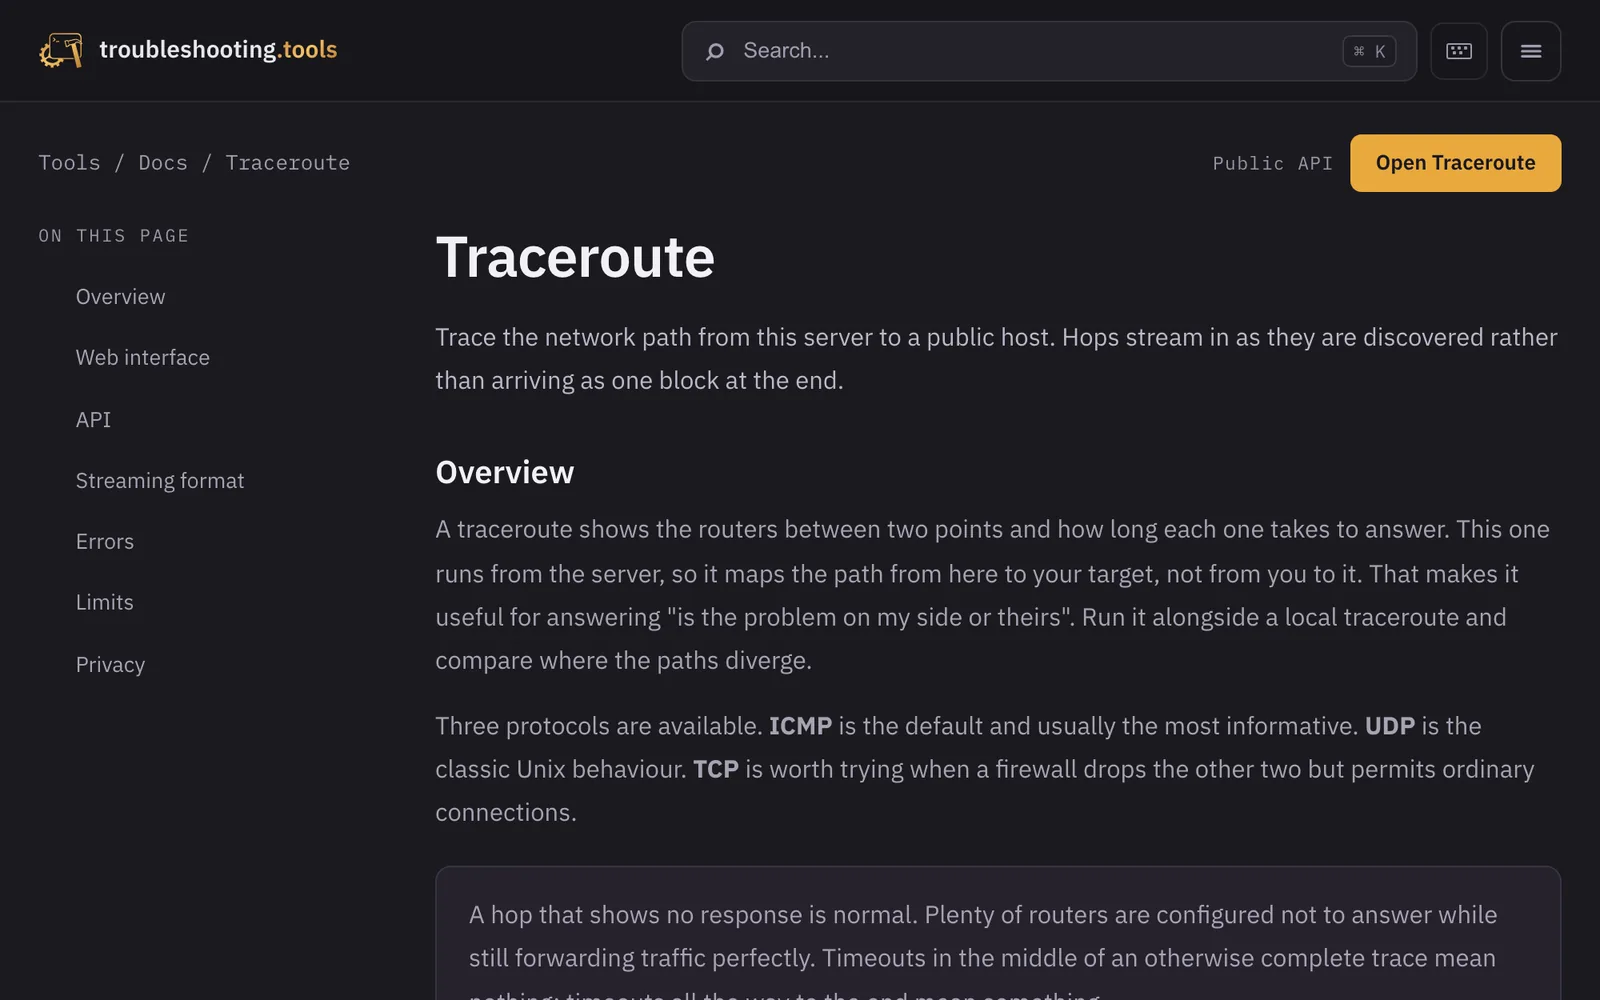
Traceroute
Hops appear live as they are found, via ICMP, UDP or TCP, with separate timeout fields and links to the IP and DNS lookups.
Part of
troubleshooting.tools
Technologies
The Challenge
A browser traceroute often waits until everything is done and then shows a block of text. If a firewall filters ICMP or UDP, the path seems to end in nowhere. And if all you see is “timeout”, you cannot tell router rate limiting from a path that is really broken.
The Solution
Every hop is streamed to the browser as NDJSON as soon as it is found. ICMP, UDP or TCP can be chosen, so a path stays traceable behind filters. Full and partial timeouts are separate fields, and every hop links to the IP and DNS lookups.
How a trace runs
Input and options
Hostname, IPv4 or IPv6 address, plus protocol (ICMP, UDP, TCP), hop limit (15, 20, 30) and wait per hop (2, 3, 5 seconds). Values outside these are refused, not silently adjusted.
Live stream
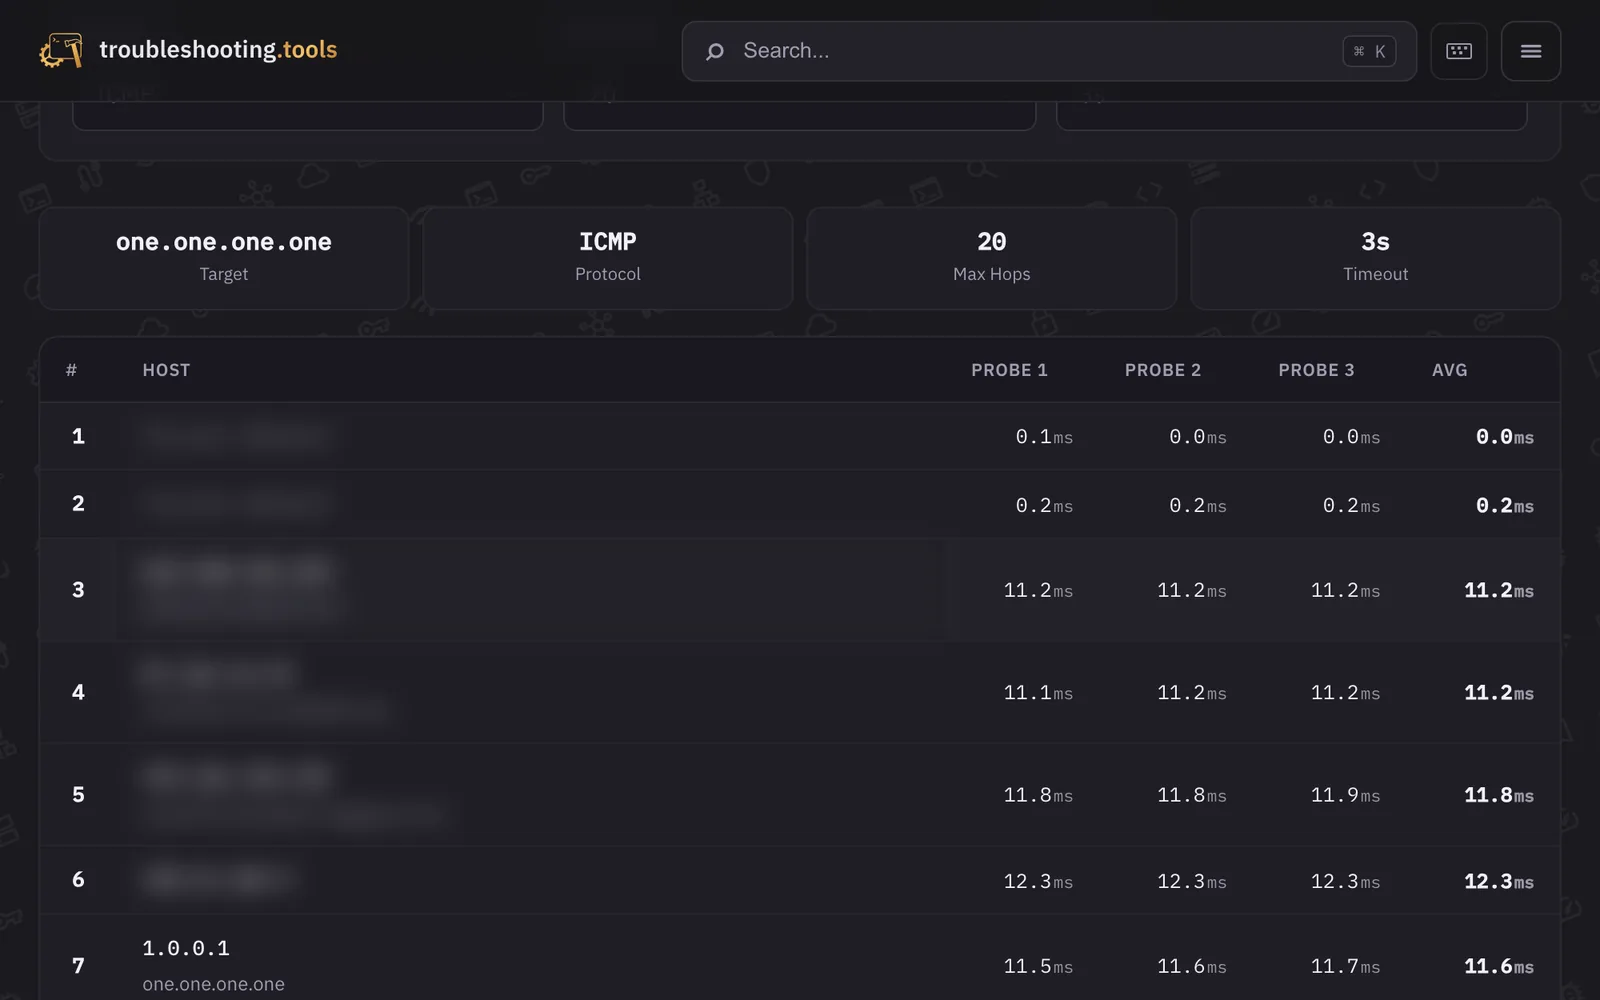
The server runs the system traceroute and streams every hop as NDJSON: number, address, reverse DNS, up to three probe times, average and timeouts. A cut-off trace keeps the hops it found.
Linked and explained
Every address opens the IP lookup, every name the DNS lookup. Private hops appear as a label instead of an address. A summary shows hop count and average, minimum and maximum latency.
API for curl
Via POST with target, protocol, hop limit and wait, the API answers with the same NDJSON stream the page shows; with curl -N the hops appear live in the terminal. Validation errors come before the stream as a real HTTP 400, not as a record inside a 200 answer. Errors after the stream has started come as a record of their own. The rate limit applies per address and responds with HTTP 429.
Hard ceilings
Hops, wait per probe and overall run time are capped, so a target that answers nothing cannot tie up the server. Stable links such as /check/traceroute/{target} start the trace when opened. The probes come from the server, not from the visitor.
Platform and operations
The tool runs on the same platform as every tool on troubleshooting.tools: plain PHP behind nginx in one Docker image, a shared layout and router, a strict Content Security Policy per route and no CDN. GitLab CI tests every branch, builds the images with Docker-in-Docker and deploys them; structured logs and external uptime checks monitor operations.
Privacy
The trace runs from the server: routers along the path and the target see the server, not the visitor. For the rate limit only a keyed hash of the address is stored, never the address itself. Target and protocol appear in the server log. The page loads nothing from third parties.
Results
A traceroute that shows live what happens, still delivers results behind filters and tells rate limiting from a broken path, in the browser and via curl.
Gallery
Screenshots of the public site with example targets.